pgAgroal Enterprise · How-to
Set up observability
Stand up the Enterprise observability layer: import the seven curated Grafana dashboards, point Prometheus at pgagroal's native metrics endpoint, and apply the bundled alerting rules. No upstream pgagroal change and no extra exporter is required.
Prerequisites
- A reachable pgagroal
/metricsendpoint (pgagroal's native Prometheus exposition). - A Prometheus instance that can scrape that endpoint.
- Grafana with permission to import dashboards and add a Prometheus data source.
Wire Prometheus scraping
Point Prometheus at the pgagroal /metrics endpoint. A minimal vanilla scrape job:
scrape_configs:
  - job_name: pgagroal
    metrics_path: /metrics
    static_configs:
      - targets: ["pgagroal:2346"]
For background on what pgagroal exposes and how the endpoint is enabled, see the pgagroal Prometheus manual.
Import the Grafana dashboards
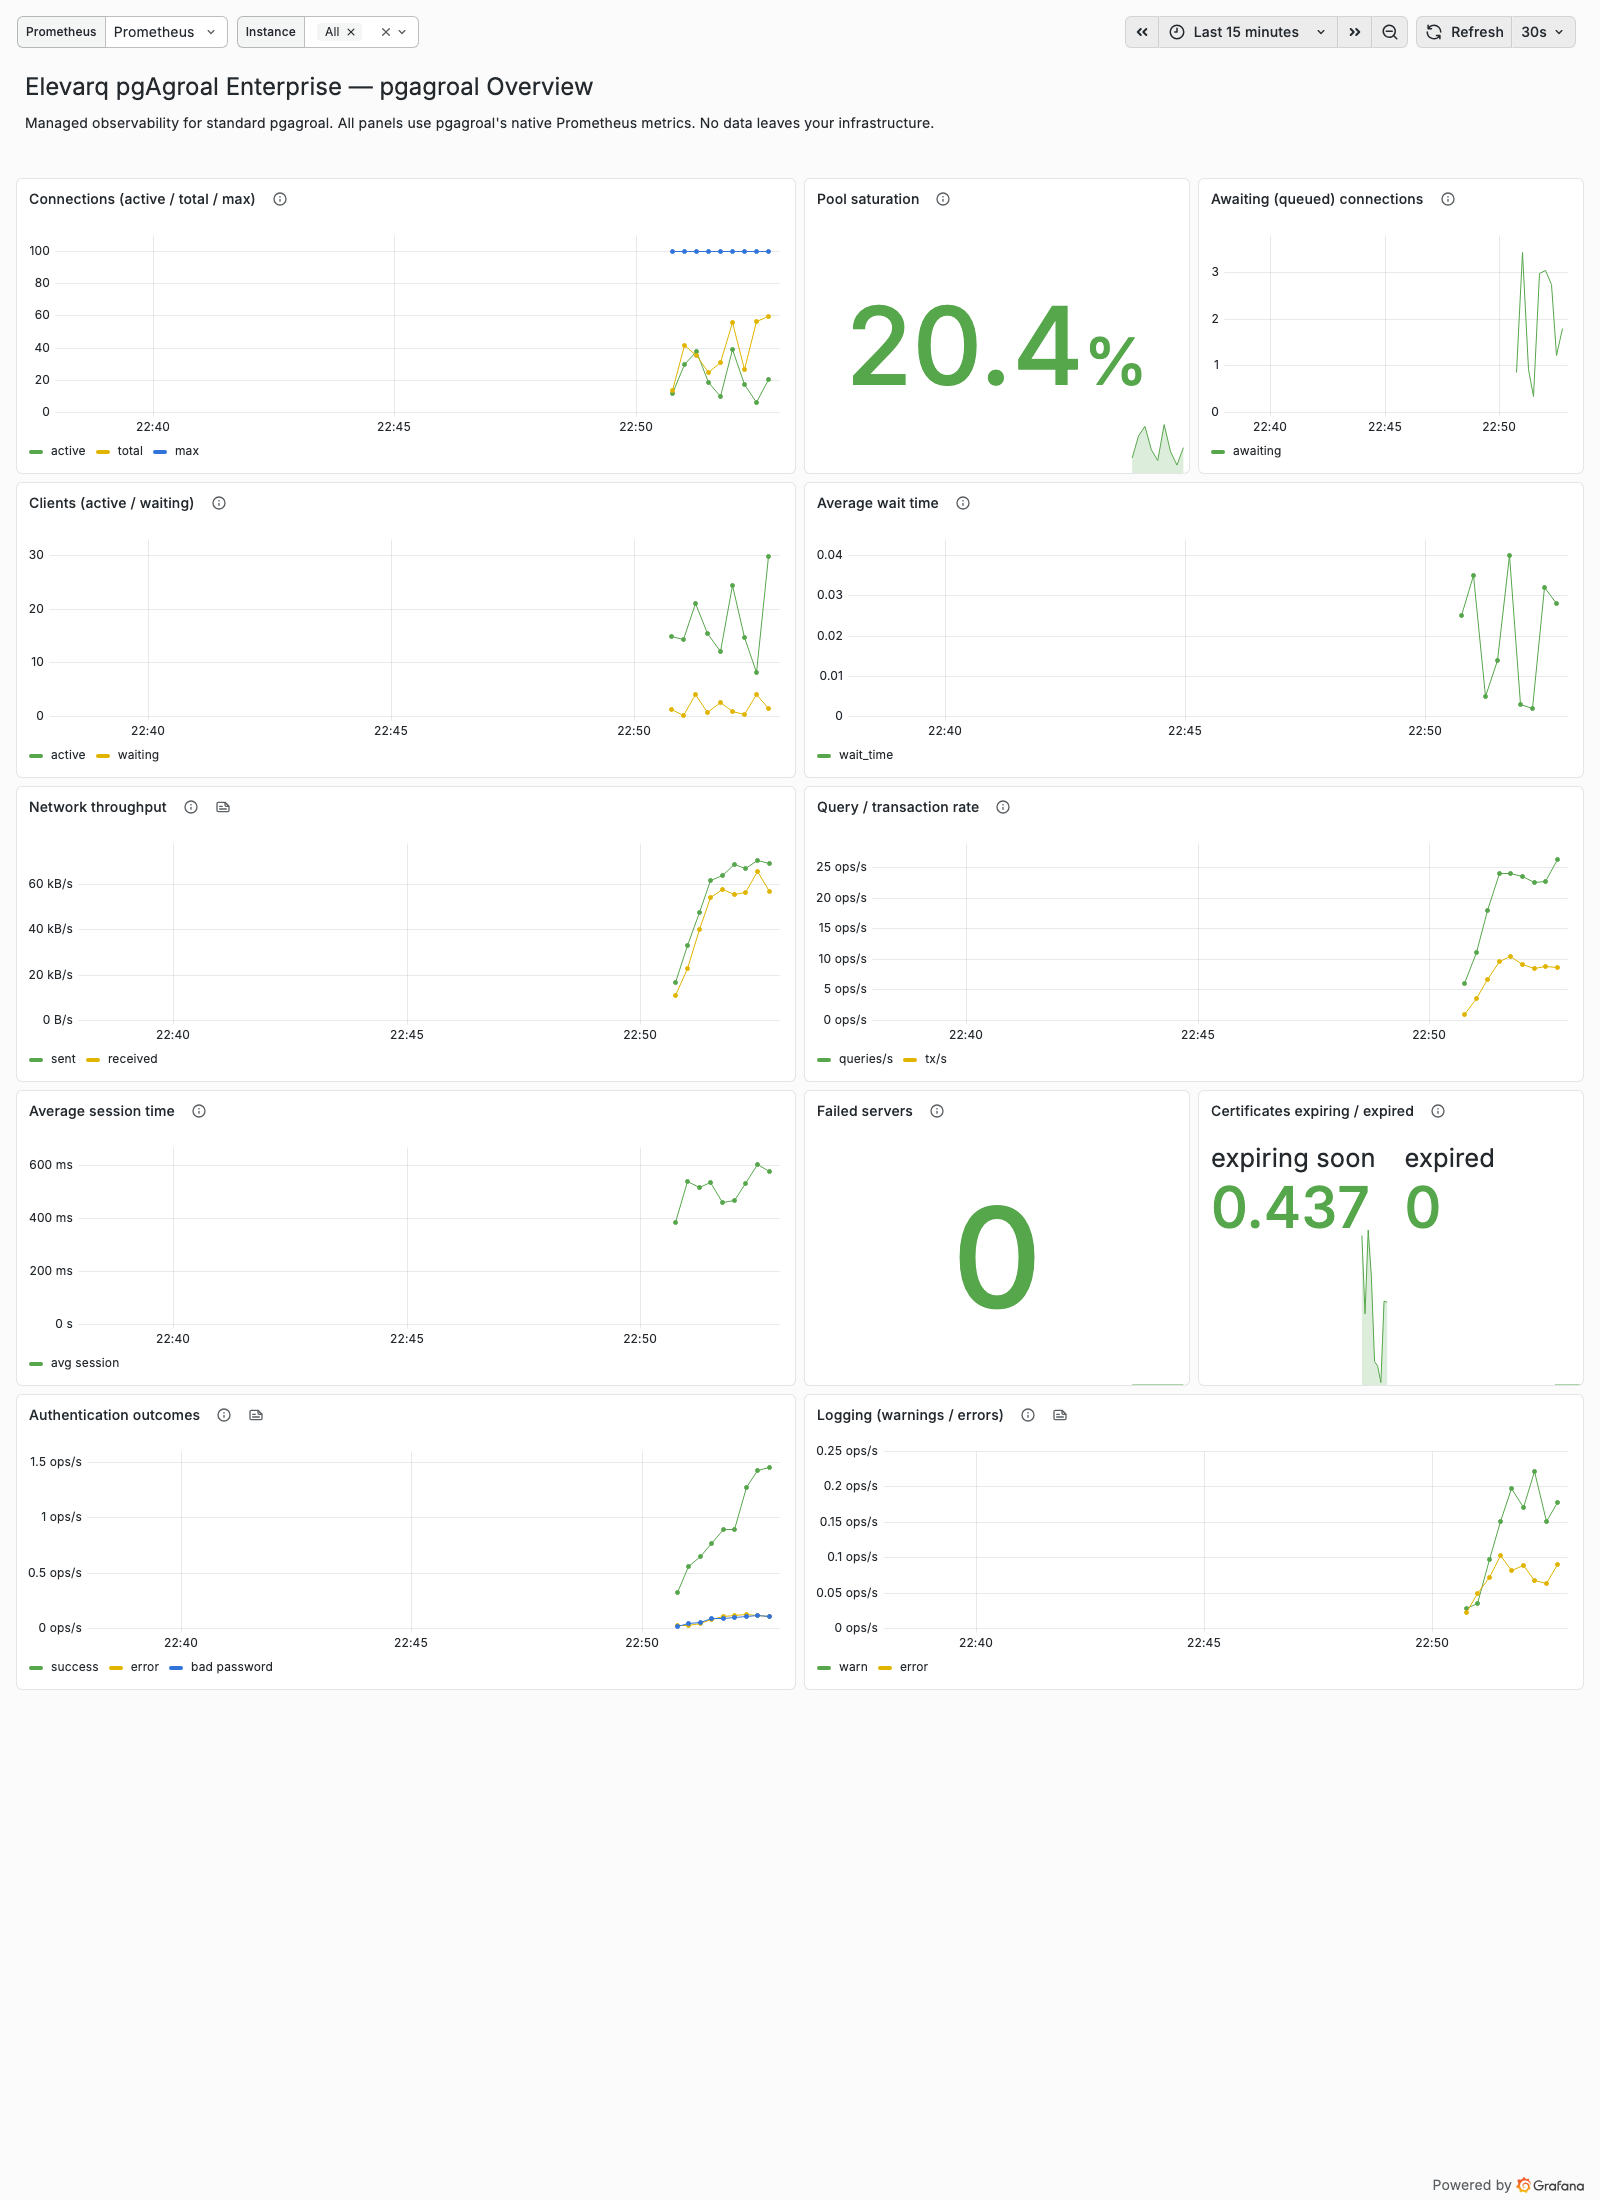
The Enterprise pack ships seven curated dashboards under observability/grafana/dashboards/. To import each one:
- Add a Prometheus data source that scrapes your pgagroal endpoint.
- In Grafana:
Dashboards → New → Importand upload the JSON file. - Pick the Prometheus data source and, optionally, an
instancewhen prompted.
Each dashboard uses a datasource template variable (no hardcoded data source) and an instance variable, so the same JSON works across environments. The seven dashboards:
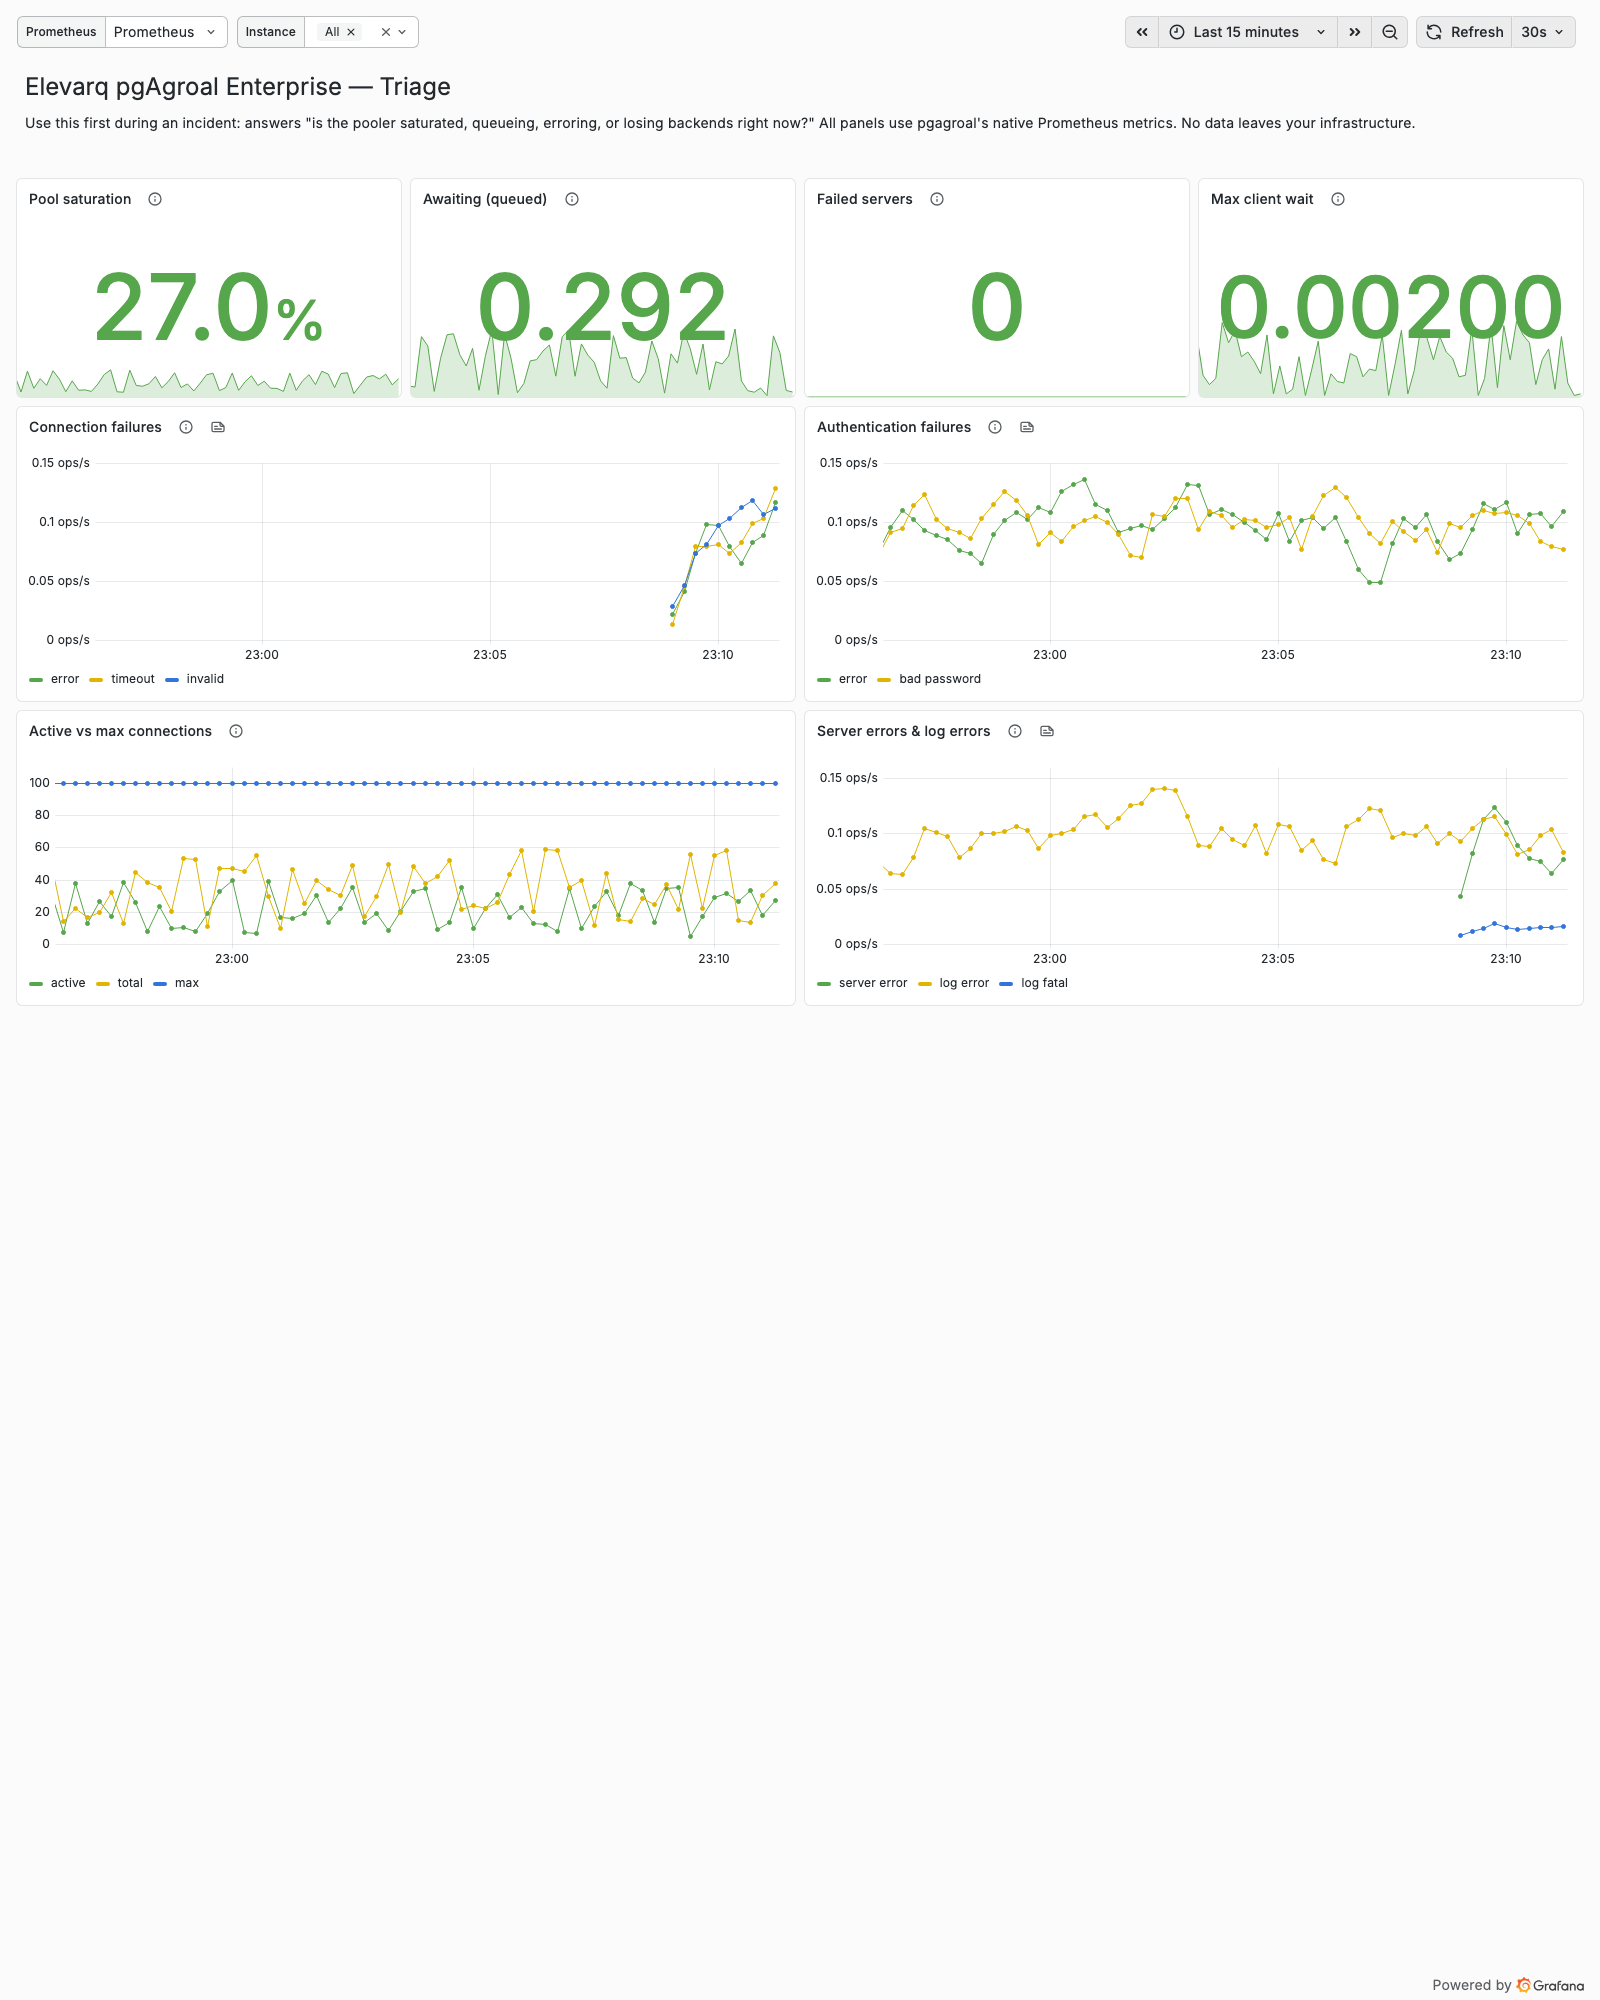
pgagroal-overview.json— Overview: general overview of pool, clients, throughput, sessions, server health, auth, certs, and logging.pgagroal-triage.json— Triage: incident triage for saturation, queueing, failures, and auth/server/log errors.pgagroal-capacity.json— Capacity: capacity planning — headroom, churn, reaping, and throughput over days/weeks.pgagroal-pgbouncer-migration.json— Migration: PgBouncer migration and cutover — parity panels plus a SHOW-to-metric mapping.pgagroal-security.json— Security: security and compliance — TLS cert posture, auth outcomes, and audit-signal logs.pgagroal-fleet.json— Fleet: fleet view — per-instance saturation, queue, and errors across many instances.pgagroal-controlplane.json— ControlPlane: control-plane ops — applies by outcome, drift checks, and the control-plane Go runtime (elevarq_cp_*).
When to use each dashboard
Match the dashboard to the question you are answering and the audience.
| Dashboard | Audience | Answers |
|---|---|---|
| Overview | anyone | What does this pgagroal instance look like overall? |
| Triage | on-call / SRE | It's on fire — is the pooler saturated, queueing, erroring, or losing backends right now? |
| Capacity | platform / SRE | Over days/weeks, how much headroom is left and should I resize the pool or tune timeouts? |
| Migration | teams migrating | Are we at parity with PgBouncer, and did anything regress at cutover? |
| Security | security / compliance | Are certs valid and renewed, and what do auth failures and error logs say? |
| Fleet | platform / SRE | Across many instances, which one is the outlier? |
| ControlPlane | platform / SRE | Are control-plane applies succeeding, is config drifting, and how is the control-plane runtime behaving? |
Apply the alerting rules
The pack ships Prometheus alerting rules at observability/prometheus/pgagroal-alerts.yaml, packaged as a Prometheus Operator PrometheusRule. The inner groups are also a valid vanilla Prometheus rule file, so you can load it either way.
With the Prometheus Operator, apply it as a custom resource:
kubectl apply -f observability/prometheus/pgagroal-alerts.yamlWithout the operator, reference the rule file from your Prometheus configuration:
rule_files:
  - pgagroal-alerts.yaml
The rules cover availability (pool saturation, queued connections, failed backends), errors (connection errors/timeouts, auth-failure spikes, FATAL logs), and TLS (expired and soon-to-expire certificates). For the full catalog — every alert, its expression, threshold, and severity — see the Alerting rules reference.
Keep dashboards and rules honest
A metric-drift guard, observability/grafana/check-metric-drift.sh, extracts every pgagroal metric referenced in the dashboards and alert rules and asserts each is present in metrics-catalog.txt — the authoritative allow-list. It runs in CI on every PR and fails on any reference to a renamed or removed metric, keeping the observability layer aligned with the metrics the shipped image actually exposes.
observability/grafana/check-metric-drift.sh # exit 0 = clean, 1 = driftNext steps
- Alerting rules reference — the full alert catalog with expressions, thresholds, and severities.
- pgagroal Prometheus manual — how to enable and what the native metrics endpoint exposes.
- Install air-gapped — the offline bundle carries the dashboards and rules too.