Implementable PostgreSQL triage tickets from your operational signals.

Elevarq Analyzer is senior-DBA-level diagnosis, packaged for CTOs, DevOps, and the engineering teams that own the database. Evidence-grounded findings. Airgap-capable. DBAs evolve from query-by-query tuning into managing the database fleet.

Or talk to us about Elevarq Analyzer.

PostgreSQL signals are noisy. Performance dashboards tell you something is wrong without telling you what to do about it. Senior DBAs can read between the lines — most teams do not have one, and the teams that do are stretched too thin to triage every incident.

How Elevarq Analyzer works

Four steps. Collect evidence, diagnose, review, push the ticket to the system you already use.

Step 1

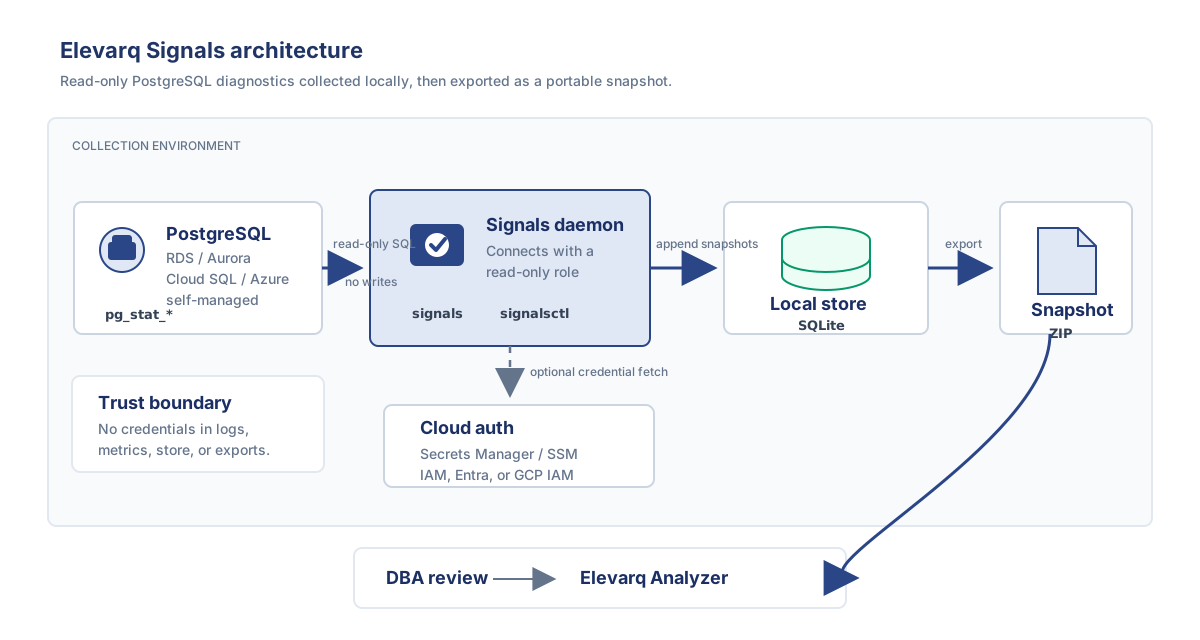
Elevarq Signals

Read-only telemetry collector. Snapshots what your PostgreSQL is doing — execution stats, wait events, configuration state. Open source.

Step 2

Elevarq Analyzer

Applies deterministic detection rules to the snapshot, then enriches each finding with Elevarq Insight — bounded LLM diagnosis grounded in the cited evidence.

Step 3

Elevarq Workbench

Operator-facing web UI. Review findings, prioritise, manage triage status, see the evidence behind every recommendation.

Step 4

Push the ticket

Implementable triage tickets go to GitHub Issues, Jira, or whatever tracker your team already uses. One-way, idempotent.

Why teams pick Elevarq Analyzer

A short list. Each one is testable on day one of an evaluation.

Airgap-capable

Runs entirely in your infrastructure. Offline-activated licenses. No phone-home, no telemetry to Elevarq.

Read-only by design

Signals connects with the pg_monitor role. No writes, no schema changes, no superuser. Three-layer safety enforcement.

Deterministic first, LLM bounded

Detection rules are deterministic. Elevarq Insight explains and ranks findings, but never invents them and never escapes the cited evidence.

Evidence-cited

Every recommendation traces to specific snapshot evidence. No vague best practices, no copy-paste advice.

What a finding looks like

Elevarq Analyzer writes the pitch. The reviewer adds the operational detail before the ticket lands in the tracker. Both halves are part of the human-in-the-loop flow.

What Elevarq Analyzer emits today

The pitch + cited evidence

  • Problem · what the signal indicates
  • Why it matters · business / operational impact
  • Evidence · cited snapshot rows, query stats, configuration values
  • Recommended action · the fix
  • + Severity and Confidence, calibrated by the detector

A full rendered sample lives on the Elevarq Analyzer product page.

What the reviewer adds before push

The operational detail

  • Implementation steps · ordered, copy-pasteable where possible
  • Validation · how to confirm the fix worked
  • Rollback · how to revert if it does not
  • Risk level · so triage prioritisation is consistent across the fleet
  • When to escalate · the criteria, written down

Elevarq Workbench is where this happens. The reviewer accepts the pitch, fills in the operational detail, and pushes the complete ticket to GitHub Issues, Jira, or your tracker.

Who Elevarq Analyzer is for

For CTOs and CIOs

De-risk PostgreSQL operations without scaling a DBA team. Predictable triage, auditable evidence, no SaaS data-egress question.

For DevOps engineers

Implementable tickets, not another dashboard. Hand the fix to whoever ships it.

For developers without a dedicated DBA

Your team owns the database because no one else does. Elevarq Analyzer is the senior DBA you do not have on staff.

For system integrators and cloud providers

Serve your customers' PostgreSQL workloads better. One Elevarq Analyzer deployment per end customer; channel-friendly.

Designed for auditability

Aligned with SOC 2 and ISO/IEC 27001 controls. We don't claim to be certified. The security page lays out the data-boundary model and what's in scope.

Elevarq Signals is open source BSD-3-Clause

Inspect the code, audit the safety enforcement, run it standalone against any PostgreSQL deployment. View on GitHub.

Two ways to start.

See how Elevarq Analyzer works, or download the open-source collector and point it at your own database.

Or talk to us about Elevarq Analyzer.